The Obama administration’s stimulus package is pumping 787 billion dollars into the U.S. economy for public works, job creation and, yes, national broadband access. But showing exactly where that money is going is a Herculean task. Earlier this month, the White House appointed Edward Tufte to the Recovery, Accountability and Transparency Board to make sure the website Recovery.gov does the job. You may not have heard of Tufte, but you've probably reaped the benefits of his work. A long-time Yale professor, author, consultant and data designer, Tufte has inspired a generation of innovators with his ideas for the efficient, clean and rich presentation of information. He’s a fan of The New York Times website, the iPhone and, most of all, the lowly sports page, with its tables and stats a reader can grasp in an instant. But he’s in a constant war with the average website, cluttered with scroll bars, logos, jargon and meaningless graphics.
EDWARD TUFTE: They make the simple complex [LAUGHS]. The design hand in there is from the marketing department, and it’s unfortunate because our eye-brain system is so powerful, in one long glance, maybe a 12-second glance at something, probably 120 megabits of information goes to our brain. And there’s no reason we have to be looking at impoverished materials because we process material at enormous rates.
BOB GARFIELD: Okay, so come now to your White House appointment, which is kind of a tough nut.
EDWARD TUFTE: [LAUGHS]
BOB GARFIELD: The data among different agencies doesn't necessarily conform. They have different ways of measuring appropriations and expenditures, and it’s really hard to get a fix. There’s not only apples and oranges, but there’s grapefruits and strawberries and kumquats out there. What’s a graphics guru to do?
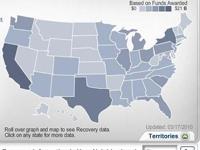
EDWARD TUFTE: Probably the first thing that most people do when they go to the website is they type in their zip code, and up pops up all the stimulus projects in their area. And what's interesting about this, it’s a huge database and the particular viewer has no interest in 99 percent of it, but via the zip code they can make it special for them, as can everybody else.
BOB GARFIELD: You know, I spent a little time recently on Recovery.gov, and to me, you know, it doesn't look bad at all. It looks like a particularly good explainer section put together by a particularly good newspaper. You know, I think that it does a pretty good job of directing me to the larger picture and also the one in my own backyard.
EDWARD TUFTE: Terrific, that’s great.
[BOTH AT ONCE]
BOB GARFIELD: When you look at Recovery.gov, do you just see a thousand problems to be solved that I'm not seeing?
EDWARD TUFTE: What I would most like to do is to make some additional things that are worthy of the zip code map and the data. One idea that I've been thinking of is called a flashlight map, and so you see a kind of dark blue United States with nothing on it, and then the dots, the little lights come on as each project started. That shows the spatial distribution, over time, of the stimulus projects. I love that you picked up the metaphor that it was like a newspaper. The first thing I said about a year ago when I met with them for the first time is that their model should be a first-rate news website.
BOB GARFIELD: Ah-ha, so the reason I'm not seeing so much to find fault with is ‘cause you've already been tinkering with this for months before your official appointment.
EDWARD TUFTE: Once we got the news metaphor and got the intense mapping, that’s halfway there. I wouldn't give it an A yet. There’s, you know, still a ways to go, and I know some of them, and I hope to, you know, find a few more.
BOB GARFIELD: Okay, so Recovery.gov is looking pretty good. You have achieved some of the clarity that you’re looking for. Other government agencies are just woeful, I mean, woeful.
EDWARD TUFTE: Yeah, the Fed’s websites are not very good. The great dream of this – I think there’s one chance in ten that it might happen – is that Recovery.gov would become a model for all government funding, so we're now talking trillions, not this piddly 787 billion. [LAUGHS]
BOB GARFIELD: As the reporting of data becomes a more effective way for the government to communicate what it’s up to, it seems to me also an opportunity for the politicians in the administration to go, huh, why can't we use this as a really powerful political tool and skew the very data that you’re trying to clarify?
EDWARD TUFTE: This is not going to be a propaganda engine of – no - –
[OVERTALK] -
BOB GARFIELD: Let me put it to you a far more direct way.
EDWARD TUFTE: Mm-hmm.
BOB GARFIELD: If Karl Rove were the - still the White House political operative and he had the opportunity to use cherry-picked data to sell his administration’s policies, it sure would have been nice for him to have a really sweet interface.
EDWARD TUFTE: I had once the rather shocking experience that Karl Rove mentioned the ten most wonderful books that he ever read and, of course, it had Machiavelli, and so on.
[BOB LAUGHS] But it also had, to my mixed delight and, and a little bit of horror, my book with the catchy title The Visual Display of Quantitative Information. [LAUGHS] Political practice today too often skips right by evidence and has preconceived and endlessly naïve views about causality and how policies work. The government’s job is to try to solve problems, and I am interested in helping them solve the problem of clarifying the stimulus and also understanding the, the consequences of the stimulus. I'm going to do the best I can and put it out in the world, and, and we'll see what happens.
BOB GARFIELD: All right. E.T., thank you very much for coming.
EDWARD TUFTE: Okay. [LAUGHS] Good, thank you.
[MUSIC UP AND UNDER]
BOB GARFIELD: Edward Tufte is author most recently of Beautiful Evidence.