Transcript
ARUN RATH:
How do you grasp the enormity of genocide? How can you comprehend the scope of terrorist threats across the globe? Now you can visualize your way to a deeper understanding of the world through the use of interactive maps.
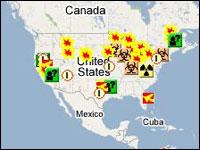
We’ll consider two: first, the Global Incident Map. Move your cursor to any part of the world marked by icons representing everything from rebel attacks to bomb scares to stolen uranium, then click for the story. It’s truly unnerving. For one thing, mysterious white powder scares happen about every hour. Morgan Clements founded the Global Incident Map, and runs it from his home in rural Missouri. He says it puts the threats into perspective.
MORGAN CLEMENTS:
Putting them on a map allows people to see where they are in reference to themselves or to relatives or to perhaps the military or the government, or law enforcement want to see where are these incidents in relation to critical infrastructure, or military bases.
The map is a little bit misleading because it looks like certain areas of the world are safer than they actually are, and that’s just a result of our inability to get news, especially from areas where the media is state-run, such as China.
ARUN RATH:
It kind of gives you a sense of just almost how impossible the task is for law enforcement. Their job is to connect the dots. There are billions of dots.
MORGAN CLEMENTS:
There are a lot of things happening in the world and in the United States. Perhaps ten percent of them actually make it onto our map. A lot of things that happen every day don’t even get reported by the media.
However, this is a tool that is useful to law enforcement. They may not have the time to sit there and scour all of the news all over the world, looking for stuff that might be of interest. So when we can provide a service, it makes it easy for them to do that. We’re really happy to be of use to them.
ARUN RATH:
Do you have any other projects in the works, or additions, modifications to Global Incident Map?
MORGAN CLEMENTS:
Oh, absolutely. We’ve already launched other versions of the map that don’t necessarily have anything to do with terrorism, for example, bird flu incidents. We’re working on a bird flu map that shows all the outbreaks in both animals and humans.
We are working on a project for one of the states that allows, in the event of a missing child, the state will be able to input the child’s last known location and bring up a map of, let’s say, a 20-mile radius of that location of all the sexual predators. And that can be a very useful tool. It might actually recover a child or save a life.
But you can map anything that you can imagine. You can map Pizza Hut locations or UFO sightings. Or this technology is commonly used to map real estate listings, so anything that you can assign a location to can be mapped.
ARUN RATH:
I wonder about this. If you’re doing this all day, I mean, does it ever get to you? Do you ever have trouble sleeping at night, just knowing all of this stuff?
MORGAN CLEMENTS:
Indeed. All day, every day, when I’m sitting here in front of the computers looking for the news articles, it’s true that everything that I see is negative. It’s children being killed, it’s bombs blowing up in buses and on trains. But I’ve been doing it for a number of years and what keeps me going is the positive feedback that I receive, especially from people in the military who appreciate the works that we’re doing and let me know that they’re able to use it.
ARUN RATH:
Morgan, thank you very much.
MORGAN CLEMENTS:
Oh, and thank you very much for having me.
ARUN RATH:
Morgan Clements is the founder and publisher of the Global Incident Map, which you can link to from onthemedia.org.
